NBCI Civil Society Initiative
NBCI Urges You To Register to Vote!
Visit VOTE.org for Everything You Need to Vote!
Key Facts About Black Eligible Voters in 2024
By Jens Manuel Krogstad and Mohamad Moslimani
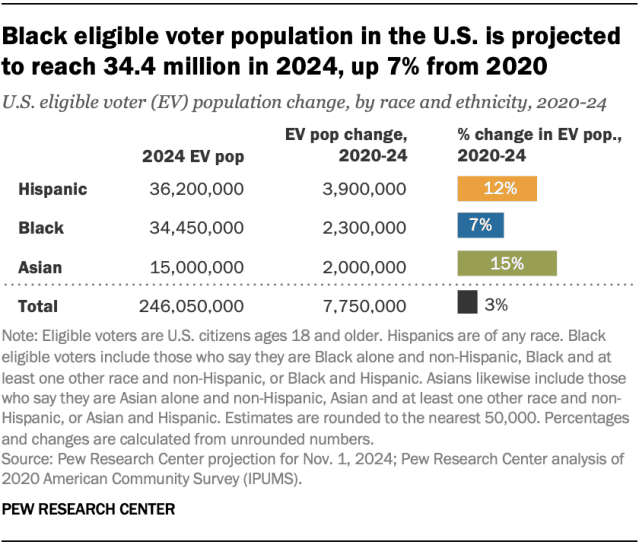
The number of Black eligible voters in the United States is projected to reach 34.4 million in November 2024 after several years of modest growth. And Black eligible voters stand out for turnout rates that are higher than among Latino and Asian eligible voters.
Black voters could play an important role in determining the outcome of key 2024 elections, including for U.S. president. In Georgia, a closely watched swing state, Black Americans account for a third of eligible voters.
In 2020, 92% of single-race Black, non-Hispanic voters cast a vote for Democrat Joe Biden, while only 8% backed Republican Donald Trump, according to a Pew Research Center analysis of validated voters.
Ahead of the 2024 presidential election, here are five key facts about Black eligible voters in the U.S., based on our own projections for 2024, as well as Census Bureau data for earlier years. (Eligible voters in this analysis are defined as citizens ages 18 and older residing in the 50 states and the District of Columbia. Not all eligible voters are actually registered to vote. Detailed demographic information about Black eligible voters is available in the drop-down box at the bottom of this post.)
In 2020, 92% of single-race Black, non-Hispanic voters cast a vote for Democrat Joe Biden, while only 8% backed Republican Donald Trump, according to a Pew Research Center analysis of validated voters.
Ahead of the 2024 presidential election, here are five key facts about Black eligible voters in the U.S., based on our own projections for 2024, as well as Census Bureau data for earlier years. (Eligible voters in this analysis are defined as citizens ages 18 and older residing in the 50 states and the District of Columbia. Not all eligible voters are actually registered to vote. Detailed demographic information about Black eligible voters is available in the drop-down box at the bottom of this post.)
Read other posts in this series
Black Americans are projected to account for 14.0% of eligible voters in the U.S. in November, according to Pew Research Center projections. The percentage of eligible voters who are Black has risen slowly in the past two decades. In 2012, for example, Black voters represented 13.2% of all eligible voters. In the last U.S. presidential election in 2020, they represented 13.5%.
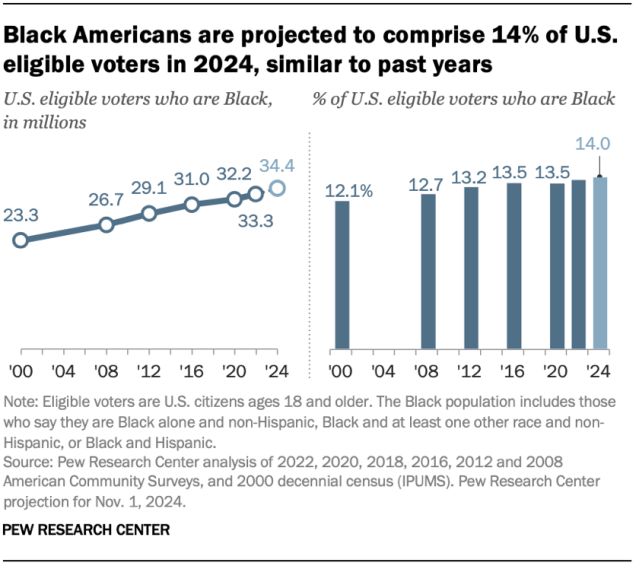
At the same time, the number of Black eligible voters has grown steadily. Between 2020 and 2024, that number has grown by an estimated 7.1%, a slower rate than among Asian eligible voters (15.3%) or Hispanic eligible voters (12.1%).
As of 2022, about half of Black eligible voters live in one of eight states. Texas has the largest number, with 2.9 million, followed by Georgia and Florida (2.6 million each). Rounding out the top eight are New York (2.4 million), California (2.0 million), North Carolina (1.8 million), and Maryland and Illinois (1.4 million each). Together, these states account for 52% of Black eligible voters in the 50 states and the District of Columbia.
As of 2022, about half of Black eligible voters live in one of eight states. Texas has the largest number, with 2.9 million, followed by Georgia and Florida (2.6 million each). Rounding out the top eight are New York (2.4 million), California (2.0 million), North Carolina (1.8 million), and Maryland and Illinois (1.4 million each). Together, these states account for 52% of Black eligible voters in the 50 states and the District of Columbia.
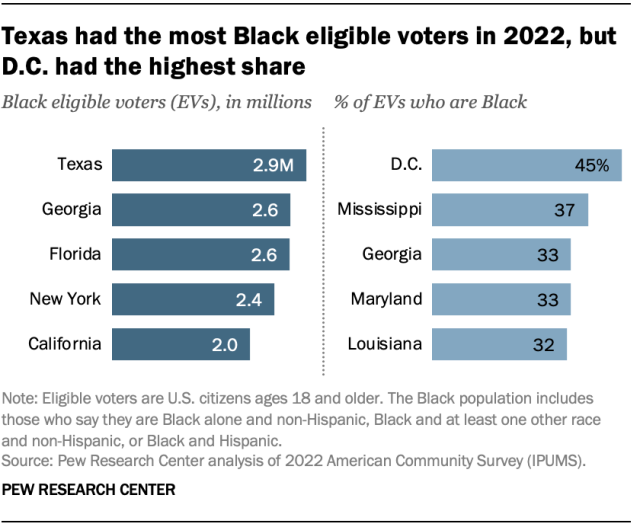
Black voters made up nearly half (45%) of all eligible voters in the District of Columbia in 2022, a higher share than in any state. Other places with large shares of Black eligible voters are Mississippi (37%), Georgia (33%), Maryland (33%) and Louisiana (32%).
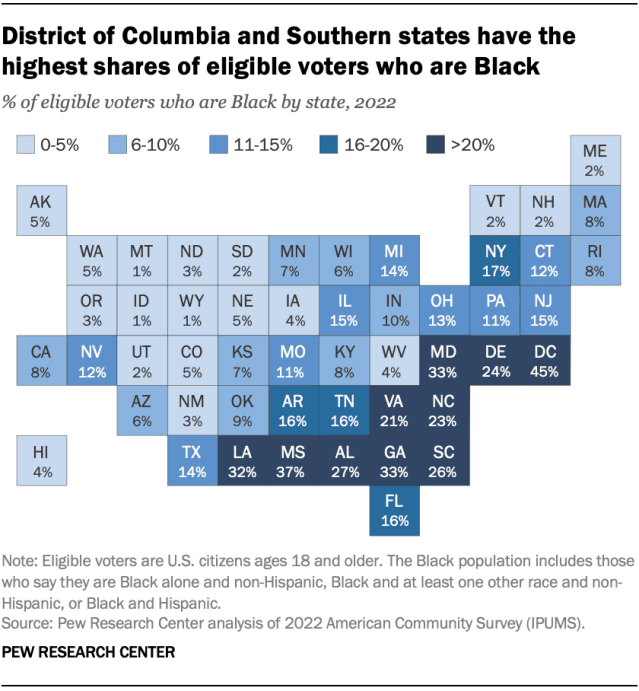
Regionally, more than half of Black eligible voters (57%) live in Southern states. The Midwest (17%) and Northeast (16%) have the next-highest shares of the nation’s Black eligible voters, while relatively few live in the West (10%).
About seven-in-ten Black people in the U.S. are eligible to vote, a higher share than among Hispanics and Asian Americans. Black Americans are more likely to be eligible to vote than some other groups because a high share are ages 18 and older (73%) and an even larger share are citizens (96%).
About seven-in-ten Black people in the U.S. are eligible to vote, a higher share than among Hispanics and Asian Americans. Black Americans are more likely to be eligible to vote than some other groups because a high share are ages 18 and older (73%) and an even larger share are citizens (96%).
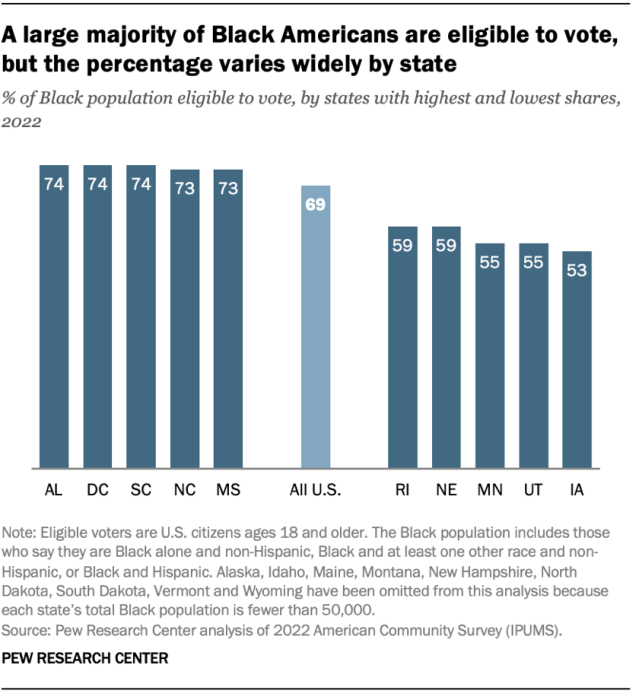
Nevertheless, the share of the Black population that is eligible to vote varies considerably by state. While 74% of all Black residents of Alabama, D.C. and South Carolina are eligible to vote, fewer than six-in-ten are eligible in Minnesota (55%), Utah (55%) and Iowa (53%).
Black eligible voters differ from the overall population of eligible voters by age, education and other factors.
Around one-in-four Black eligible voters (23%) have a bachelor’s degree, lower than the share among all U.S. adults eligible to vote (33%). Another 34% of Black eligible voters have some college education or an associate degree. The remaining 43% have a high school diploma or less, compared with 36% of all eligible voters.
Black eligible voters differ from the overall population of eligible voters by age, education and other factors.
Around one-in-four Black eligible voters (23%) have a bachelor’s degree, lower than the share among all U.S. adults eligible to vote (33%). Another 34% of Black eligible voters have some college education or an associate degree. The remaining 43% have a high school diploma or less, compared with 36% of all eligible voters.
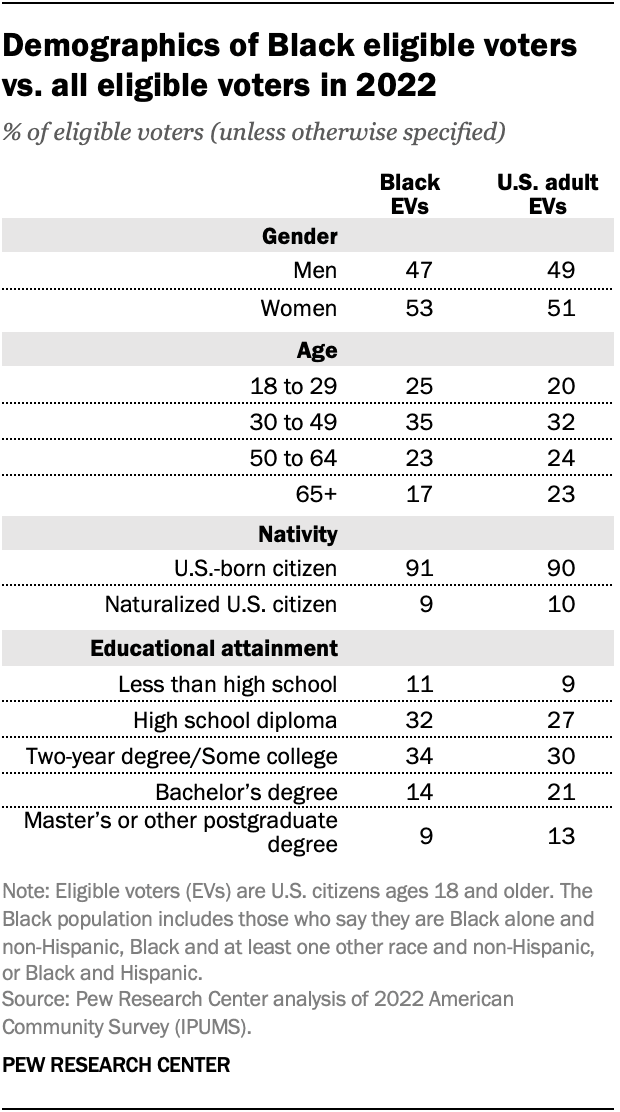
Black eligible voters are more likely than eligible voters to be women (53% vs. 51%). They also tend to be younger than eligible voters overall: 60% of Black eligible voters are under the age of 50, compared with 52% of all U.S. eligible voters.
Detailed data on Black eligible voters by state in 2022
Topics
Share This Link: